Archive for the ‘web stats’ Tag
How to Read Your Webstats – Part 5 – Search Engine Referrals
My final post in my weeklong blog on using your NetSource hosting webstats. By now you’re probably picking up on how the webstats program works and following through with the logic flow outlined in my earlier posts. The section of the webstats program I want to talk about today is probably the most exciting to me as this is looking at what search engines are referring visitors to your site and what keywords they typed in to find your site.
In previous postings I gave you a screenshot of the graph I was referring to, but I am not in this case as screenshots would identify a website they are associated with – this data is very specific to the website or an industry in general. However, if you are logged into your stats program, the graphs will be located towards the bottom of the main screen. On the “Connect to site from” graph, the first half of the graph specifically outlines how my visitors have come to your site from various search engines for the selected month. Google, for the most part, will commonly dominate this stat, because, well, they’re Google and they dominate the world right now. The second part of the graph is more unique from site to site as it will show you top links to your website from other websites (external links) that have chosen to link to you (or directory sites that you have submitted your website to for display). If you have a lot of search engine and external links referring traffic to you, you probably have a site that has been live for over 6 months, have good content and your site is well optimized. If your site is still new, note that it takes the search engines a while until they start taking your site seriously. The simple fact is that search engines proceed with caution on new sites, but after you have been online for awhile they’ll start warming up to you.
The “Search Keyphrases (Top 10)” graph shows you the top keyword phrases someone typed into a search engine that lead them to your website. It is interesting to see as sometimes you’ll find visitors are typing in search phrases you never thought they would use. Using this data can be good at evaluating your keywords and finding out if re-optimization is needed. Just make sure you have at least a few months of data that accurately reflects consistent trends.
How to Read Your Webstats – Part 4 – Most Popular Pages
Ok, now that we know how long visitors are staying on your site (see last post here) we will want to determine which pages are getting the most views. Knowing your most popular pages will help you to determine what is of most interest to your viewers as well as what is getting overlooked.
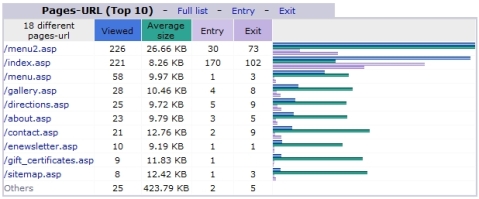
The above graph is an example of what your page view stats will look like. Most of the time your most popular page will be your home page. This is obvious, as it is always the first thing someone sees when they type in your website address. However, if most of your visitors are coming from search engines, the most popular page could be whatever page ranks the highest most often in the search engines.
Usually the page file names in the graph will follow a common naming convention. For example, your Contact Us page will be usually be called “contact.asp” or “contact_us.asp”. Your home page file name won’t be as obvious at first glance. This is because for a web hosting server to know which page on your site is determined as being the home page, it will need to be called “default.asp” or “index.asp”. If you see one of those file names, you will know that it is the home page.
All the stat graphs are initially displayed with up to 10 listings each. You will see a small link in the title of the graph that says “Full list”. Click this link to see all of the data for that graph. In this case, clicking “Full list” next to the “Pages-URL” title header will open the data for all the pages on your site (assuming you have more than 10 pages). This way you can either view all your stats as a quick summary overview or view all data for a particular section you want to know more about. Additionally, for “Pages-URL” you also have links for “Entry” and “Exit” these link to listings of the pages that were the most common entry pages on the site or the most common pages someone said “I’m outta here” and left the site.
All this data is useful to find out if visitors are going to the pages you want them to see. If they are missing important pages you can better determine if visitors simply aren’t interested in those pages or if they need to be prompted with a stronger call-to-action to visit those pages. For example, adding a big (but tasteful) banner on the home page that says “Click here to find out more about our great deals on car insurance” or whatever you need to promote.
How to Read Your Webstats – Part 3 – Duration of Visit
If your site is hosted with NetSource Technologies, another important webstat to look at for insight is the graph of “Visits duration” in your included statistics program. This graph will tell you how “sticky” your site is – or in other words, how long people are sticking around. The longer the better of course, as it indicates that visitors have found interest in your service or products and are taking the time to browse longer.
The above graph is pretty typical of many websites – most people are hit-and-run site visitors going from site to site, quickly sizing sites up until they find a site that appears to be close to what they are looking for. At this point they then venture deeper into the site to acquire more information. If a large portion of your visitors are sticking around for less than 30 seconds, those visitors are definitely not doing business with you – unless they you and are just making a quick visit to get a phone number or street address.
Like all stats, you have to view them with a grain of salt. It may be tempting to say that you have alot of visitors spending over an hour on your site, but you never know if someone walked away from their computer to answer a phone and then went on to other things leaving your site open and racking up time on your webstats. If your site can be read twice in less than 15 minutes, then hour plus sessions may not be important, but if you have a huge online store with thousands of intentory items, those hour plus sessions will mean more. While it is not scientific, in most cases (non high inventory e-commerce sites or social based sites), I look at the 2 to 30 minute visits to gauge site stickiness.
The longer you keep visitors around the more opportunity you have to convert them to a buying customer.
How to Read Your Webstats – Part 2 – Are the Search Engines Indexing Your Site
Yesterday’s article addressed the main question everyone wants to know regarding the website stats for their website – how many visitors did I have? Today, let’s look at how many search engine spiders are visiting your site.
Yuck, spiders!
Actually these are good spiders. The word spider just plays into the “web” terminology for the internet. Search engine spiders go by other names too, such as crawlers and bots. All search engine spiders are is an automated visit to your site by the search engines for the purpose of reviewing the content on your website. If it is their first visit, they are going to gather as much as they can and try and figure out what the essense of your site is all about. On follow up visits they are going to compare your site content to their last visit to see if anything has changed or has been added. Frequent updates to your site tells the spider your site is active and as a result the spider will come back to your site more often since it knows you are changing content frequently. The more spider activity on your site the better and over time it will allow content changes to your site to make it to the search listings faster.
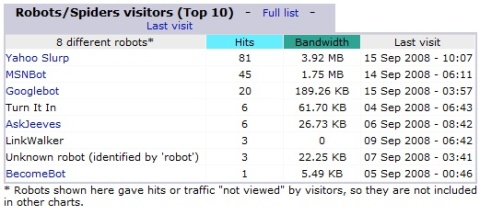
The above graph is an example of what you might see for spider visits to your site for the current month. Yahoo, MSN and Google are all regularly visiting this website – which is a good thing. Yahoo in particular is visiting often.
The more information you have on your website, the better. If you are concerned about your rankings in the search engines, reviewing spider activity on your site will give you an idea of the interest level from the search engines. If you are not seeing rankings for your keywords but seeing alot of spider activity then you will want to know what the search engines are ranking for your site and determine if your message is off. But don’t forget – time is your friend when it comes to search engine rankings and useful stat reporting. If your site is new, even with alot of spider activity, it may take a few months for rankings to start improving and all the data to start correlating.
How to Read Your Webstats – Part 1 – Monthly Visitors
If you host your website with us, you have an online statistic program built in as a standard hosting feature. This statistics program allows you to check important data regarding the success of your website. It also allows you to find out if marketing campaigns are working, what pages are the most popular, what search engines are referring visitors to you and what keywords these visitors are using to find you in a search. Checking these statistics on a regular basis will help to monitor the health of your site and catch potential problems early so they can be corrected.
At a minimum, you should check your stats on a monthly basis to see if you are on an upward or downward trend. If you are down a few visitors from the month before, this just might be normal fluctuation and nothing to be concerned with. However, if you have multiple months where your traffic is going down or you have initiated a new marketing campaign promoting your website and your traffic is down, this is something you will want to address right away to find out why traffic is suffering.
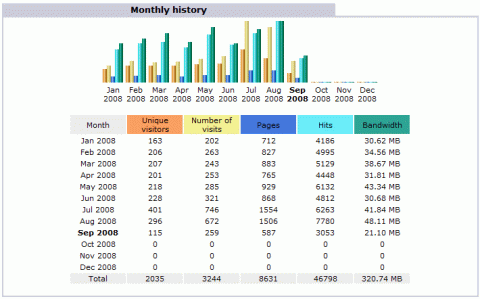
In most cases, traffic will generally be on an upward trend as search engine rankings improve, more people become aware of the site and more links from other websites point to you. Here is a screenshot of an example of what your monthly traffic might look like in our statistics software:
In most cases, the most important column to review is the orange column – number of Unique visitors. This is the closest stat you will get to the actual number of visitors that come to your site. The next column tells you how many times your site was visited by the number of unique visitors – some visitors might come back to the site at a later time to view it again. Next is the number of pages on the site your visitors viewed. Hits, dispite the overuse of the word in regards to webstats, is really not that useful as it only refers to server requests and doesn’t indicate number of visitors. Bandwidth simply lets you know how much bandwidth your site is using.
In this graph above, we see that the monthly traffic, for the most part is on a slow increase from month to month until July when a spike occurs in the traffic. Prehaps a new marketing campaign was launched that month, an article in a paper was published about the company or a site keyword gained a high ranking. The site traffic fell in August, but was still better than average. However, at the half point in September, the site is projected at 230 visitors – still above average, but worth exploring further to see why the sharp incline in July was not carrying over. Whatever happened in July needs to be discovered so it can be repeated again.
There is a ton more stats to review, so look for further articles. If you have your hosting with NetSource but are not familiar with your stat’s website address, call me at (352) 732-7700 or (800) 709-3240 and I’ll look it up for you.
 Leave a comment


